
Stop debugging from a distance.
Logs and APM tools tell you when your pipeline breaks—not where, why, or for whom. Inngest provides deep insight into context at the step level— so you can fix fast.
Your pipeline breaks at 2am—now what?
Finding the answer used to mean grepping logs and hunting trace IDs. Here's the problem with the standard way of resolving incidents:
GREPPING LOGS
One-off scripts just to answer basic questions
NO STEP-LEVEL CONTENT
See the failure, not where or why
SLOW RESOLUTION
Correlation can cost you hours


Full observability.No extra instrumentation.

Observability closer to code,not deeper in infrastructure.
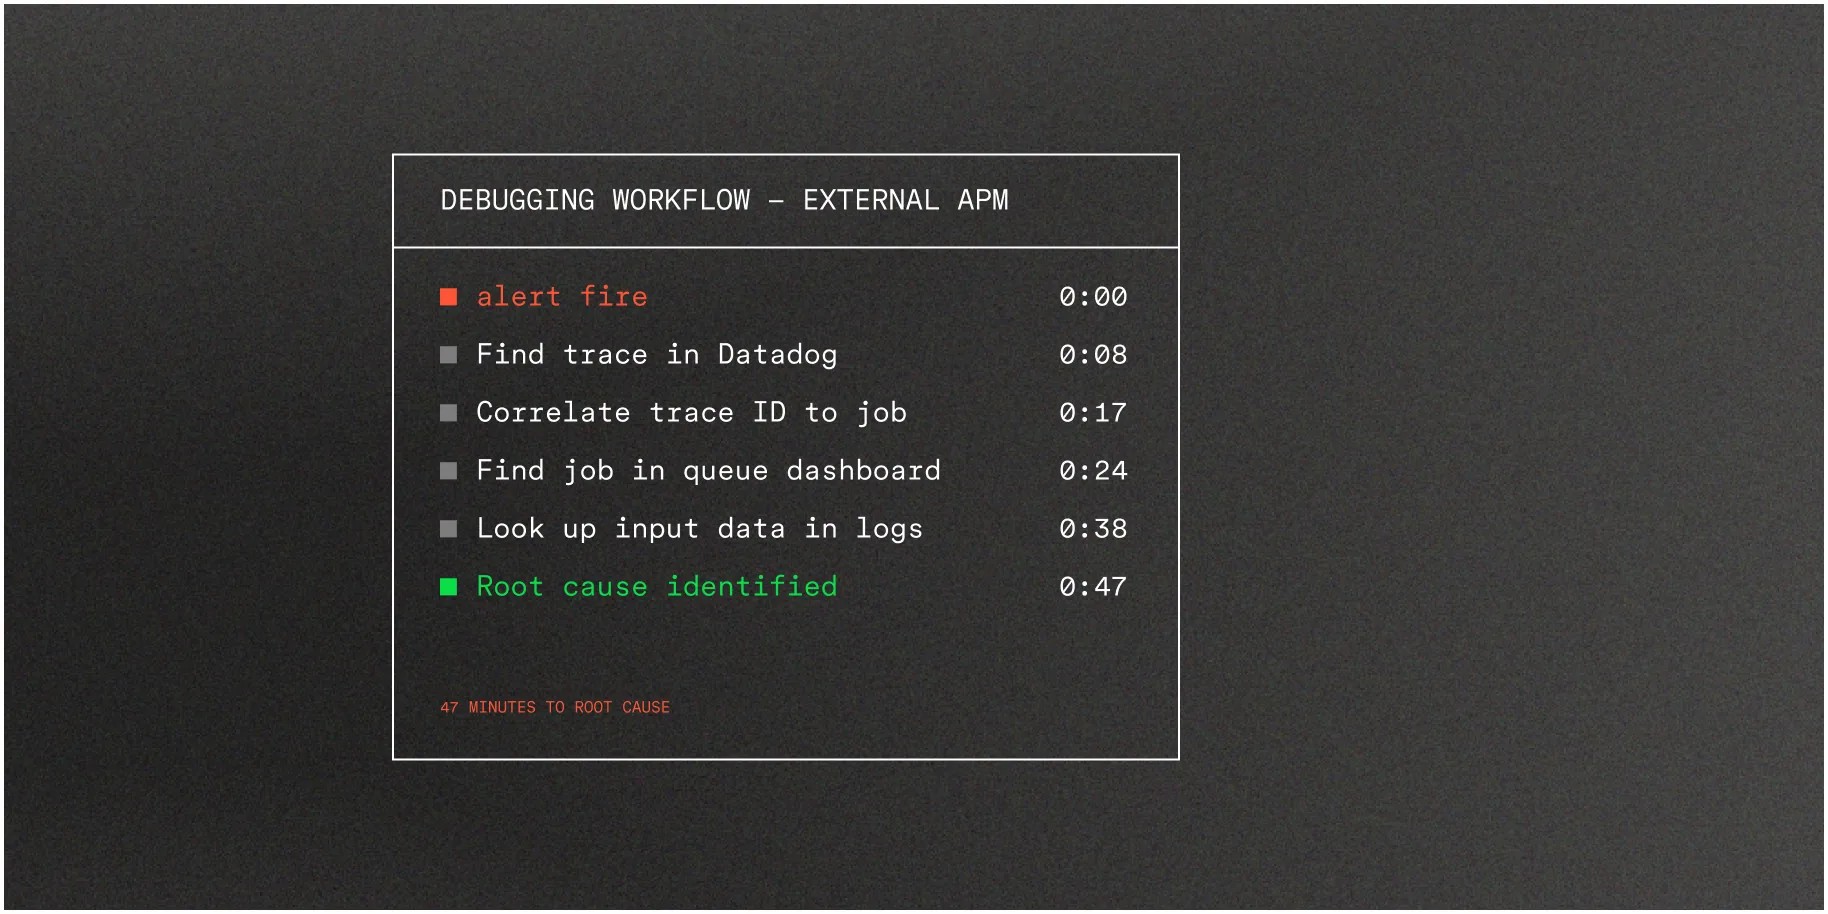
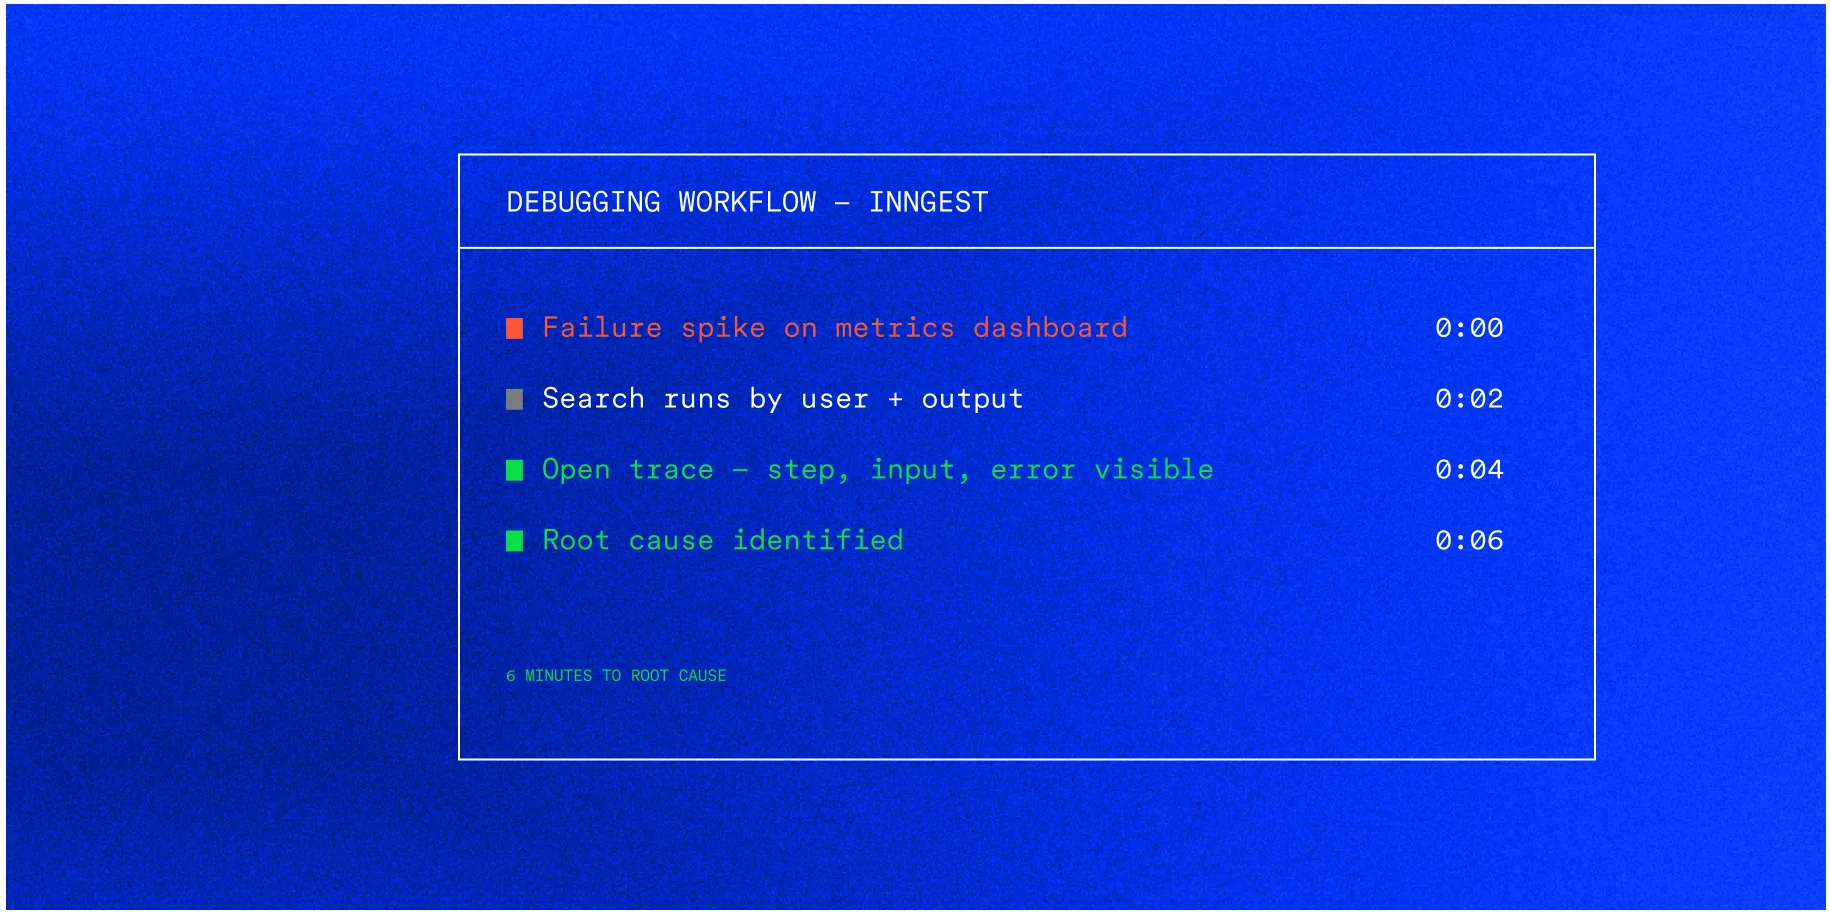
Debugging in APM tools means starting with a trace ID, finding the span, mapping to a job, then looking up the input data.
With Inngest, the data lives where execution happens—the failed step, its input, its output, its retry history, all in the same place you manage the function.
Insights
Query your runs like a database.
Queues weren't built to query. BullMQ makes you export it first—ETL pipeline, warehouse, one-off scripts—just to answer basic questions about your own system.
Insights makes it much easier. Query event and run data with SQL from the dashboard. *Which functions failed this hour? What's the error pattern across the last 7 days? What did a specific user's run return?* No plumbing required.
Insights — SQL Editor
-- What errors are causing the most failures today?
SELECT
  simpleJSONExtractString(data, 'message') as error,
  COUNT(*) as failed_count
FROM events
WHERE name = 'inngest/function.failed'
  AND ts > now() - INTERVAL '1 day'
GROUP BY error
ORDER BY failed_count DESC

AI & Insights
Know why your AI loops.
An agent running as a single function call is completely opaque. You see it started. You see it failed. You have no idea what prompts went in, what came back, or where it went wrong.
Stop building infrastructure around your infrastructure.
Add observability to any function in minutes. Works with your existing code, wherever it runs.